Partitioning Module
The partitioning module implements a novel radial cytoplasmic partitioning algorithm that divides the cytoplasm between nuclear envelope (NE) and plasma membrane (PM) into concentric shells. This enables standardized spatial analysis across cells of varying geometries and imaging modalities, addressing a key challenge in quantitative cell biology.
Overview
Radial partitioning normalizes the cytoplasmic space into radial shells from NE to PM, providing a unified framework for spatial quantification. This approach is particularly powerful for:
Cross-cell comparisons: Eliminating biases from variations in nuclear and cellular shapes
Multi-modal integration: Enabling direct comparison of organelle distributions across WFM, SIM, SXT, and cryo-ET
Radial Distribution Function (RDF) analysis: Quantifying organelle localization patterns with fine-grained spatial resolution
Key Features
Pure NE-PM Pair Method: Fast and interpretable partitioning based on shell point clouds generated from NE-PM pairs
Boundary Extraction: Automatic identification and extraction of cellular membrane structure boundary points using Gaussian smoothing
Spatial Pairing: NE-PM point mapping based on angular similarity for robust pair generation
Coordinate Extraction: Sampling partition coordinates for downstream RDF and interaction analysis
3D Visualization: Multi-level visualization tools for partitioning results
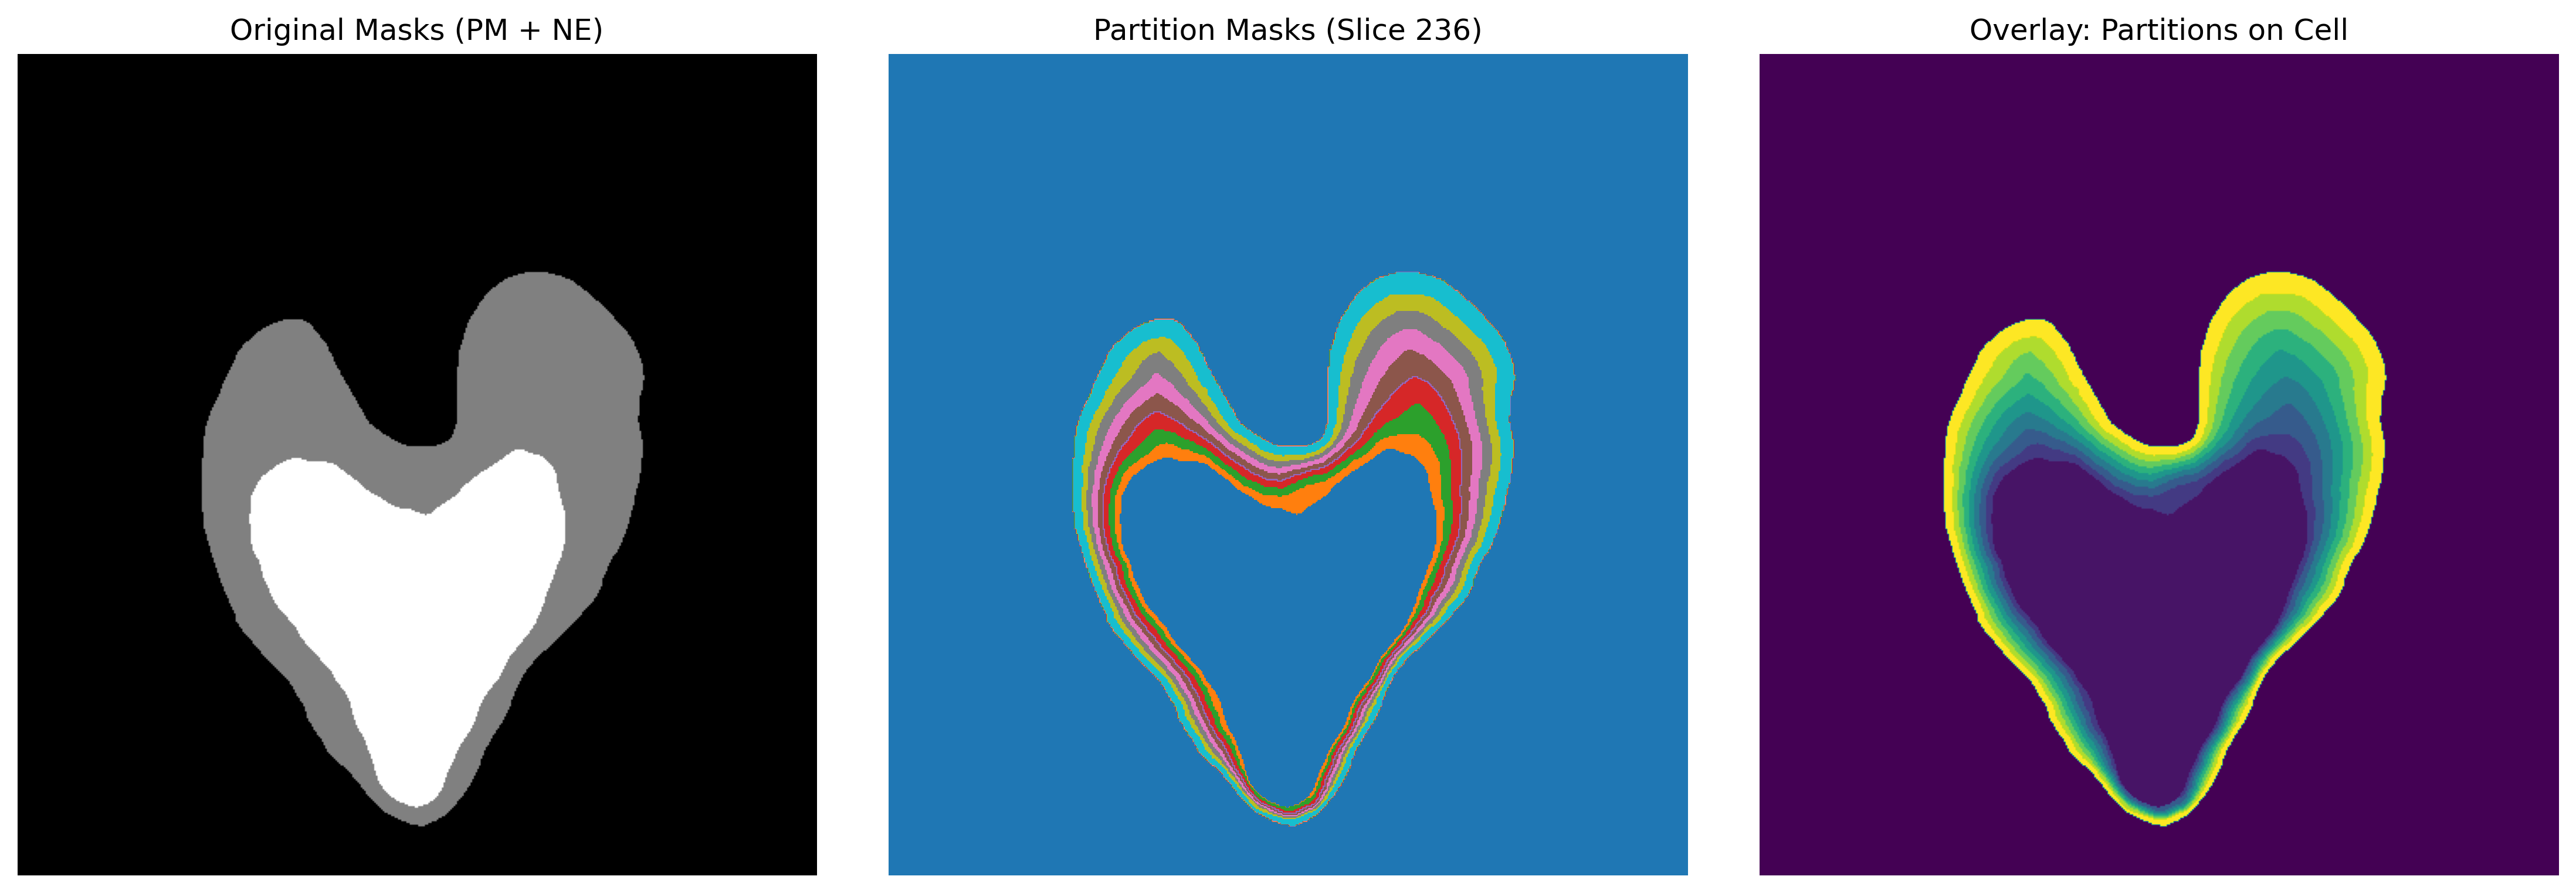
Figure 1: Cellular radial partitioning visualization. Left: Original PM and NE masks; Middle and Right: Radial partitioning results with 8 concentric shells from NE to PM, showing color gradient representation of spatial zones.
Partitioning Class
- class ipa.processing.partitioning.Partitioning(root_dir, n_slices=8, num_cores=None)[source]
Bases:
objectThis class provides a comprehensive toolkit for cellular partitioning analysis, including boundary extraction, partition generation, feature calculation, and visualization. Primarily used for analyzing organelle spatial distribution between nuclear envelope and plasma membrane.
Parameters
- root_dirstr
Root directory path for result outputs
- n_slicesint, default=8
Number of radial partitions, dividing nucleus-membrane distance into n_slices regions
- num_coresint, optional
Number of CPU cores for parallel processing, defaults to 1
Attributes
- root_dirstr
Output directory path
- n_slicesint
Number of partitions
- num_coresint
Number of CPU cores
- load_mask_data(ne_path, pm_path)[source]
Load nuclear envelope (NE) and plasma membrane (PM) mask data from files
Supports multiple file formats including numpy arrays (.npy), TIFF images (.tif/.tiff), MRC format (.mrc), and other common biological imaging formats.
- Parameters:
ne_path (str) – Path to nuclear envelope mask file
pm_path (str) – Path to plasma membrane mask file
- Returns:
(ne_mask, pm_mask) - Binary mask arrays for nuclear envelope and plasma membrane
- Return type:
tuple of numpy.ndarray
- Raises:
FileNotFoundError – When specified file paths do not exist
ValueError – When file format is unsupported or data format is incorrect
Examples
>>> ne_mask, pm_mask = partitioner.load_mask_data("nuclear.npy", "membrane.npy")
>>> print(f"NE mask shape: {ne_mask.shape}, PM mask shape: {pm_mask.shape}")
- static smooth_mask(mask: ndarray, sigma: float = 1.0, close_iter: int = 2) ndarray[source]
Smooth binary mask using Gaussian filtering and morphological closing.
- Parameters:
mask (numpy.ndarray) – Input binary mask.
sigma (float) – Sigma for Gaussian filter. Higher values produce smoother boundaries.
close_iter (int) – Number of iterations for morphological closing to fill small gaps.
- Returns:
Smoothed binary mask.
- Return type:
numpy.ndarray
- extract_ne_pm_edges(pm_mask, ne_mask, smooth_sigma=1.0, smooth_close_iter=2)[source]
Extract nuclear envelope and plasma membrane boundary points and cellular center from 3D mask data
Uses morphological operations to extract proper boundaries instead of EDT method which may produce incorrect boundary representations.
- Parameters:
pm_mask (numpy.ndarray) – 3D binary mask of plasma membrane, shape (Z, Y, X)
ne_mask (numpy.ndarray) – 3D binary mask of nuclear envelope, shape (Z, Y, X)
smooth_sigma (float, optional) – Sigma for Gaussian smoothing. Set to 0 to disable smoothing.
smooth_close_iter (int, optional) – Iterations for morphological closing to fill small gaps.
- Returns:
center (numpy.ndarray) – Cell center coordinates, shape (3,), order (Z, Y, X)
ne_edge (numpy.ndarray) – Nuclear envelope boundary point coordinates array, shape (N, 3)
pm_edge (numpy.ndarray) – Plasma membrane boundary point coordinates array, shape (M, 3)
- static min_angle(ne_points, pm_point, center)[source]
Find nuclear envelope point with minimal angle to plasma membrane point relative to center
Calculates cosine angles between vectors to find the directionally closest nuclear envelope point. Used for establishing optimal NE-PM point pair matching.
- Parameters:
ne_points (numpy.ndarray) – Nuclear envelope point coordinates array, shape (N, 3)
pm_point (numpy.ndarray) – Single plasma membrane point coordinates, shape (3,)
center (numpy.ndarray) – Cell center coordinates, shape (3,)
- Returns:
Nuclear envelope point coordinates with minimal angle, shape (3,)
- Return type:
numpy.ndarray
Notes
Uses cosine similarity to calculate vector angles: cos(angle) = dot product of vectors divided by product of their magnitudes Selects the point with maximum cosine value, i.e., minimal angle.
Examples
>>> closest_ne = Partitioning.min_angle(ne_points, pm_point, center)
>>> print(f"Closest NE point: {closest_ne}")
- find_ne_pm_pairs(center, ne_edge, pm_edge, step=8, save_txt=False, dataid=None)[source]
Pair nuclear envelope and plasma membrane boundary points using GPU acceleration.
- static points_along_vector(p1, p2, n_slices)[source]
Generate equally spaced division points between two points
Creates n_slices+1 equally spaced points along the vector from p1 to p2, including start and end points. These points are used to create boundary surfaces for radial partitions.
- Parameters:
p1 (numpy.ndarray) – Starting point coordinates, shape (3,)
p2 (numpy.ndarray) – Ending point coordinates, shape (3,)
n_slices (int) – Number of division segments
- Returns:
Equally spaced points array, shape (n_slices+1, 3)
- Return type:
numpy.ndarray
Examples
>>> points = Partitioning.points_along_vector([0,0,0], [10,10,10], 4)
>>> print(f"Generated {len(points)} division points")
- shell_partition(pairs, cell_mask=None)[source]
Generate shell partition points from paired NE-PM points with adaptive partitioning
Creates equally spaced partition points along the connection line for each NE-PM point pair, with adaptive subdivision for better handling of irregular cell shapes.
- Parameters:
pairs (numpy.ndarray) – Paired points array, shape (K, 6)
cell_mask (numpy.ndarray, optional) – Binary mask indicating the active cell regions, shape (H, W, D)
- Returns:
Shell points list, each element is a coordinate array of all points in one shell
- Return type:
list of numpy.ndarray
Notes
Optimized version with adaptive partitioning for irregular cell shapes
- create_nepm_radial_partitions_with_edt(ne_edge, pm_edge, shape, n_slices=None, pm_mask=None, ne_mask=None)[source]
Optimized version of radial partition generation
- Parameters:
ne_edge (numpy.ndarray) – Nuclear envelope boundary coordinates array, shape (N, 3)
pm_edge (numpy.ndarray) – Plasma membrane boundary coordinates array, shape (M, 3)
shape (tuple) – Shape of original image volume (Z, Y, X)
n_slices (int, optional) – Number of radial partitions, defaults to self.n_slices
pm_mask (numpy.ndarray, optional) – Original plasma membrane mask for improved accuracy
ne_mask (numpy.ndarray, optional) – Original nuclear envelope mask for improved accuracy
- Returns:
3D partition mask array where each voxel value indicates partition ID (0=background)
- Return type:
numpy.ndarray
Notes
Uses local EDT-guided pair matching for better handling of irregular cell shapes
- shell_partition_optimized(pairs, cell_mask=None)[source]
Optimized version of shell partition generation with parallel processing support
- extract_partition_coordinates(partition_mask, sampling_density=0.1)[source]
Extract coordinate points from continuous partition mask for saving in XVG format
- Parameters:
partition_mask (numpy.ndarray) – 3D partition mask array
sampling_density (float, default=0.1) – Sampling density, 0.1 means sampling 10% of points
- Returns:
List of coordinate points for each partition
- Return type:
list of numpy.ndarray
- save_partition_coords_to_xvg(partition_coords, dataid, output_dir)[source]
Save partition coordinates to XVG format file
- Parameters:
partition_coords (list of numpy.ndarray) – List of partition coordinates
dataid (str) – Data identifier
output_dir (str) – Output directory
- Returns:
Output directory path
- Return type:
str
- create_nepm_radial_partitions(ne_edge, pm_edge, shape, n_slices=None, pm_mask=None, ne_mask=None)[source]
Create radial partitions using pure NE-PM pair information without EDT guidance
This method generates radial partitions based solely on the shell points created from NE-PM pairs, without using Euclidean Distance Transform for edge refinement. It’s more straightforward and computationally efficient than the EDT-guided version.
- Parameters:
ne_edge (numpy.ndarray) – Nuclear envelope boundary coordinates array, shape (N, 3)
pm_edge (numpy.ndarray) – Plasma membrane boundary coordinates array, shape (M, 3)
shape (tuple) – Shape of original image volume (Z, Y, X)
n_slices (int, optional) – Number of radial partitions, defaults to self.n_slices
pm_mask (numpy.ndarray, optional) – Original plasma membrane mask for defining cell boundaries
ne_mask (numpy.ndarray, optional) – Original nuclear envelope mask for defining nuclear boundaries
- Returns:
3D partition mask array where each voxel value indicates partition ID (0=background)
- Return type:
numpy.ndarray
Notes
This pure pair-based method is recommended when: - You want faster computation without EDT overhead - The cell shape is relatively regular - You prefer simpler, more interpretable partitioning logic
Examples
>>> partition_mask = partitioner.create_nepm_radial_partitions(
...     ne_coords, pm_coords, (100, 200, 200), n_slices=8
... )
>>> print(f"Created partitions with shape: {partition_mask.shape}")
- create_shell_based_partitions(ne_edge, pm_edge, shape, n_slices=None, pm_mask=None, ne_mask=None)[source]
Deprecated: Use create_nepm_radial_partitions_with_edt instead.
This method is kept for backward compatibility.
- create_nepm_radial_partitions_pure_pairs(ne_edge, pm_edge, shape, n_slices=None, pm_mask=None, ne_mask=None)[source]
Alias for create_nepm_radial_partitions().
This method name explicitly indicates it uses the pure NE-PM pair approach without EDT guidance. It’s provided for clarity and backward compatibility.
See also
create_nepm_radial_partitionsThe main implementation
create_nepm_radial_partitions_with_edtEDT-guided alternative
The Partitioning class provides the complete workflow for radial cytoplasmic partitioning, from boundary extraction to coordinate sampling.
Core Methods
extract_ne_pm_edges
- Partitioning.extract_ne_pm_edges(pm_mask, ne_mask, smooth_sigma=1.0, smooth_close_iter=2)[source]
Extract nuclear envelope and plasma membrane boundary points and cellular center from 3D mask data
Uses morphological operations to extract proper boundaries instead of EDT method which may produce incorrect boundary representations.
- Parameters:
pm_mask (numpy.ndarray) – 3D binary mask of plasma membrane, shape (Z, Y, X)
ne_mask (numpy.ndarray) – 3D binary mask of nuclear envelope, shape (Z, Y, X)
smooth_sigma (float, optional) – Sigma for Gaussian smoothing. Set to 0 to disable smoothing.
smooth_close_iter (int, optional) – Iterations for morphological closing to fill small gaps.
- Returns:
center (numpy.ndarray) – Cell center coordinates, shape (3,), order (Z, Y, X)
ne_edge (numpy.ndarray) – Nuclear envelope boundary point coordinates array, shape (N, 3)
pm_edge (numpy.ndarray) – Plasma membrane boundary point coordinates array, shape (M, 3)
Extracts boundary points from nuclear envelope and plasma membrane masks using Gaussian smoothing for robust edge detection.
Parameters:
pm_mask(np.ndarray): Plasma membrane binary maskne_mask(np.ndarray): Nuclear envelope binary masksmooth_sigma(float, optional): Gaussian smoothing sigma. Default: 1.0
Returns:
center(np.ndarray): Cell center coordinates (Z, Y, X)ne_edge(np.ndarray): NE boundary point coordinates (N, 3)pm_edge(np.ndarray): PM boundary point coordinates (M, 3)
Example:
from ipa.processing.partitioning import Partitioning
from ipa.data_loader import UniversalDataLoader

# Initialize partitioner
partitioner = Partitioning(root_dir="results/", n_slices=8)

# Load masks
ne_mask = UniversalDataLoader.load_data("nuclear_envelope.mrc")
pm_mask = UniversalDataLoader.load_data("plasma_membrane.mrc")

# Extract boundaries
center, ne_edge, pm_edge = partitioner.extract_ne_pm_edges(pm_mask, ne_mask)
print(f"Cell center: {center}")
print(f"NE points: {len(ne_edge)}, PM points: {len(pm_edge)}")
create_nepm_radial_partitions
- Partitioning.create_nepm_radial_partitions(ne_edge, pm_edge, shape, n_slices=None, pm_mask=None, ne_mask=None)[source]
Create radial partitions using pure NE-PM pair information without EDT guidance
This method generates radial partitions based solely on the shell points created from NE-PM pairs, without using Euclidean Distance Transform for edge refinement. It’s more straightforward and computationally efficient than the EDT-guided version.
- Parameters:
ne_edge (numpy.ndarray) – Nuclear envelope boundary coordinates array, shape (N, 3)
pm_edge (numpy.ndarray) – Plasma membrane boundary coordinates array, shape (M, 3)
shape (tuple) – Shape of original image volume (Z, Y, X)
n_slices (int, optional) – Number of radial partitions, defaults to self.n_slices
pm_mask (numpy.ndarray, optional) – Original plasma membrane mask for defining cell boundaries
ne_mask (numpy.ndarray, optional) – Original nuclear envelope mask for defining nuclear boundaries
- Returns:
3D partition mask array where each voxel value indicates partition ID (0=background)
- Return type:
numpy.ndarray
Notes
This pure pair-based method is recommended when: - You want faster computation without EDT overhead - The cell shape is relatively regular - You prefer simpler, more interpretable partitioning logic
Examples
>>> partition_mask = partitioner.create_nepm_radial_partitions(
...     ne_coords, pm_coords, (100, 200, 200), n_slices=8
... )
>>> print(f"Created partitions with shape: {partition_mask.shape}")
Creates radial partitions using pure NE-PM pair information without EDT guidance. This is the recommended method for most applications, offering fast computation with interpretable logic.
Algorithm Overview:
Generate NE-PM point pairs based on angular similarity from cell center
Create intermediate shell points along each NE-PM pair at equal intervals
Assign cytoplasmic voxels to partitions based on distance to shells with relative position interpolation (60%/40% threshold)
Post-process with morphological closing to fill small gaps
Parameters:
ne_edge(np.ndarray): NE boundary coordinates (N, 3)pm_edge(np.ndarray): PM boundary coordinates (M, 3)shape(tuple): Output volume shape (Z, Y, X)n_slices(int, optional): Number of radial partitions. Default: 8pm_mask(np.ndarray, optional): Original PM mask for defining cell boundariesne_mask(np.ndarray, optional): Original NE mask for defining nuclear boundaries
Returns:
partition_mask(np.ndarray): 3D partition mask where voxel values indicate partition ID (0=background, 1-N=partition IDs)
Biological Significance:
This method creates concentric shells that normalize for cell shape variations, enabling direct comparison of organelle distributions across different cells and imaging modalities. The pure pair-based approach is particularly suitable for SIM/WFM data where cell shapes are relatively regular.
Example:
# Create 8 radial partitions
partition_mask = partitioner.create_nepm_radial_partitions(
    ne_edge, pm_edge,
    shape=volume_shape,
    n_slices=8,
    pm_mask=pm_mask,
    ne_mask=ne_mask
)

# Check partition distribution
unique_ids = np.unique(partition_mask)
print(f"Created {len(unique_ids)-1} partitions")
for pid in unique_ids[unique_ids > 0]:
    count = np.sum(partition_mask == pid)
    print(f"Partition {pid}: {count} voxels")
extract_partition_coordinates
- Partitioning.extract_partition_coordinates(partition_mask, sampling_density=0.1)[source]
Extract coordinate points from continuous partition mask for saving in XVG format
- Parameters:
partition_mask (numpy.ndarray) – 3D partition mask array
sampling_density (float, default=0.1) – Sampling density, 0.1 means sampling 10% of points
- Returns:
List of coordinate points for each partition
- Return type:
list of numpy.ndarray
Extracts coordinate points from partition mask for downstream RDF analysis. Uses random sampling to reduce memory usage while maintaining spatial distribution patterns.
Parameters:
partition_mask(np.ndarray): 3D partition masksampling_density(float, optional): Sampling ratio (0-1). Default: 0.1 (10% of voxels)
Returns:
partition_coords(dict): Dictionary mapping partition ID (int) to coordinate arrays (np.ndarray of shape [N, 3])
Example:
# Extract coordinates with 5% sampling
partition_coords = partitioner.extract_partition_coordinates(
    partition_mask,
    sampling_density=0.05
)

for partition_id, coords in partition_coords.items():
    print(f"Partition {partition_id}: {len(coords)} sampled points")
save_partition_coords_to_xvg
- Partitioning.save_partition_coords_to_xvg(partition_coords, dataid, output_dir)[source]
Save partition coordinates to XVG format file
- Parameters:
partition_coords (list of numpy.ndarray) – List of partition coordinates
dataid (str) – Data identifier
output_dir (str) – Output directory
- Returns:
Output directory path
- Return type:
str
Saves partition coordinates in XVG format for compatibility with analysis modules. XVG is a simple text format that stores 3D coordinates with layer indices.
Parameters:
partition_coords(dict): Dictionary of partition coordinates fromextract_partition_coordinates()dataid(str): Dataset identifier for filenameoutput_dir(str): Output directory path
Output Format:
The XVG file contains lines in the format: x y z partition_id, where coordinates are in voxel units.
Example:
# Save coordinates for RDF analysis
partitioner.save_partition_coords_to_xvg(
    partition_coords,
    dataid="sample_cell_01",
    output_dir="results/partitions/"
)
# Creates: results/partitions/sample_cell_01_partition_coords.xvg
Visualization Functions
visualize_partitions
- ipa.processing.partitioning.visualize_partitions(partition_masks, slice_idx=None, save_path=None)[source]
Visualize radial partition zones in 2D or 3D.
- Parameters:
partition_masks (list of numpy.ndarray) – List of partition masks for each radial zone
slice_idx (int, optional) – Z-slice index for 2D visualization (shows 3D if None)
save_path (str, optional) – Path to save the visualization
Generates 2D slice visualization of partitioning results with customizable color mapping.
Parameters:
partition_list(list): List of binary masks for each partition layerslice_idx(int): Index of Z-slice to displaysave_path(str, optional): Path to save the figure. If None, displays interactively
Example:
from ipa.processing.partitioning import visualize_partitions

# Create list of binary masks for each partition
partition_list = [partition_mask == i for i in range(1, 9)]

# Visualize middle slice
visualize_partitions(
    partition_list=partition_list,
    slice_idx=partition_mask.shape[0] // 2,
    save_path="results/partitions_slice.png"
)
plot_partition_features
- ipa.processing.partitioning.plot_partition_features(features_df, save_path=None)[source]
Plot partition feature analysis results.
- Parameters:
features_df (pandas.DataFrame) – Feature table from compute_partition_features
save_path (str, optional) – Path to save the plot
Generates statistical charts showing volume distribution and geometric features of each partition layer.
Parameters:
partition_mask(np.ndarray): 3D partition masksave_path(str, optional): Path to save the figure
Output:
Bar chart showing voxel count per partition
Summary statistics table
Example:
from ipa.processing.partitioning import plot_partition_features

plot_partition_features(
    partition_mask,
    save_path="results/partition_statistics.png"
)
Complete Workflow Example
This example demonstrates the complete partitioning workflow from mask loading to coordinate extraction:
from ipa.processing.partitioning import Partitioning
from ipa.data_loader import UniversalDataLoader
import numpy as np

# Step 1: Initialize partitioner
partitioner = Partitioning(
    root_dir="results/",
    n_slices=8,  # Create 8 radial partitions
    num_cores=4  # Use 4 CPU cores for parallel processing
)

# Step 2: Load cellular membrane mask data
ne_mask = UniversalDataLoader.load_data("data/nuclear_envelope.mrc")
pm_mask = UniversalDataLoader.load_data("data/plasma_membrane.mrc")
print(f"Loaded masks with shape: {pm_mask.shape}")

# Step 3: Extract boundary coordinates
center, ne_edge, pm_edge = partitioner.extract_ne_pm_edges(pm_mask, ne_mask)
print(f"Detected cell center: {center}")
print(f"NE boundary points: {len(ne_edge)}, PM boundary points: {len(pm_edge)}")

# Step 4: Create radial partitions using pure NE-PM pair method
partition_mask = partitioner.create_nepm_radial_partitions(
    ne_edge, pm_edge,
    shape=pm_mask.shape,
    n_slices=8,
    pm_mask=pm_mask,
    ne_mask=ne_mask
)

# Check partition distribution
unique_ids = np.unique(partition_mask)
print(f"Created {len(unique_ids)-1} radial partitions")
for pid in sorted(unique_ids[unique_ids > 0]):
    count = np.sum(partition_mask == pid)
    print(f"  Partition {pid}: {count} voxels")

# Step 5: Extract and save coordinate data for RDF analysis
partition_coords = partitioner.extract_partition_coordinates(
    partition_mask,
    sampling_density=0.05  # Sample 5% of voxels
)

partitioner.save_partition_coords_to_xvg(
    partition_coords,
    dataid="sample_cell_01",
    output_dir="results/partitions/"
)
print("Partition coordinates saved to: results/partitions/sample_cell_01_partition_coords.xvg")

# Step 6: Visualize results
from ipa.processing.partitioning import visualize_partitions, plot_partition_features

# 2D slice visualization
partition_list = [partition_mask == i for i in range(1, 9)]
visualize_partitions(
    partition_list=partition_list,
    slice_idx=pm_mask.shape[0] // 2,
    save_path="results/partitions_slice.png"
)

# Statistical analysis
plot_partition_features(
    partition_mask,
    save_path="results/partition_statistics.png"
)
Output Data Formats
XVG Coordinate Files
The XVG format is a simple text-based format for storing 3D coordinates with layer indices. Each line contains:
`
x y z partition_id
`
Features:
3D coordinate points for each partition layer
Layer index markers (1 to N)
Sampling density control via
sampling_densityparameterCompatible with downstream RDF and interaction analysis modules
Example XVG file content:
# Partition coordinates for sample_cell_01
# Format: x y z partition_id
45.2 120.5 30.1 1
46.8 121.2 30.5 1
...
50.3 130.7 35.2 2
...
Usage in Analysis Modules
The partition coordinates can be directly used with analysis functions:
from ipa.analysis import calculate_rdf_from_xvg, load_partition_coords_from_xvg

# Load partition coordinates
partition_coords = load_partition_coords_from_xvg(
    "results/partitions/sample_cell_01_partition_coords.xvg"
)

# Calculate RDF for ISG
rdf_results = calculate_rdf_from_xvg(
    organelle_mask=isg_mask,
    partition_coords=partition_coords,
    radial_positions=radial_positions_dict,
    bins=8
)

print(f"ISG RDF values: {rdf_results['rdf']}")